State of Software 2025: Rethinking the Playbook
Annual Topline Growth and Operational Efficiency Report
Powered by more than a decade’s worth of proprietary data, our annual Growth & Efficiency report can equip operators with actionable insights to support decision-making in today’s rapidly evolving environment.
Below, we break down key insights from this year’s report and what we think it means for the state of software in 2025. Download the full report (here) to access the comprehensive insights.
State of Software 2025: Rethinking the Playbook
Annual Topline Growth and Operational Efficiency Report
Powered by more than a decade’s worth of proprietary data, our annual Topline Growth & Operational Efficiency report can equip operators with actionable insights to support decision-making in today’s rapidly evolving environment.
Below, we break down key insights from this year’s report and what we think it means for the state of software in 2025.
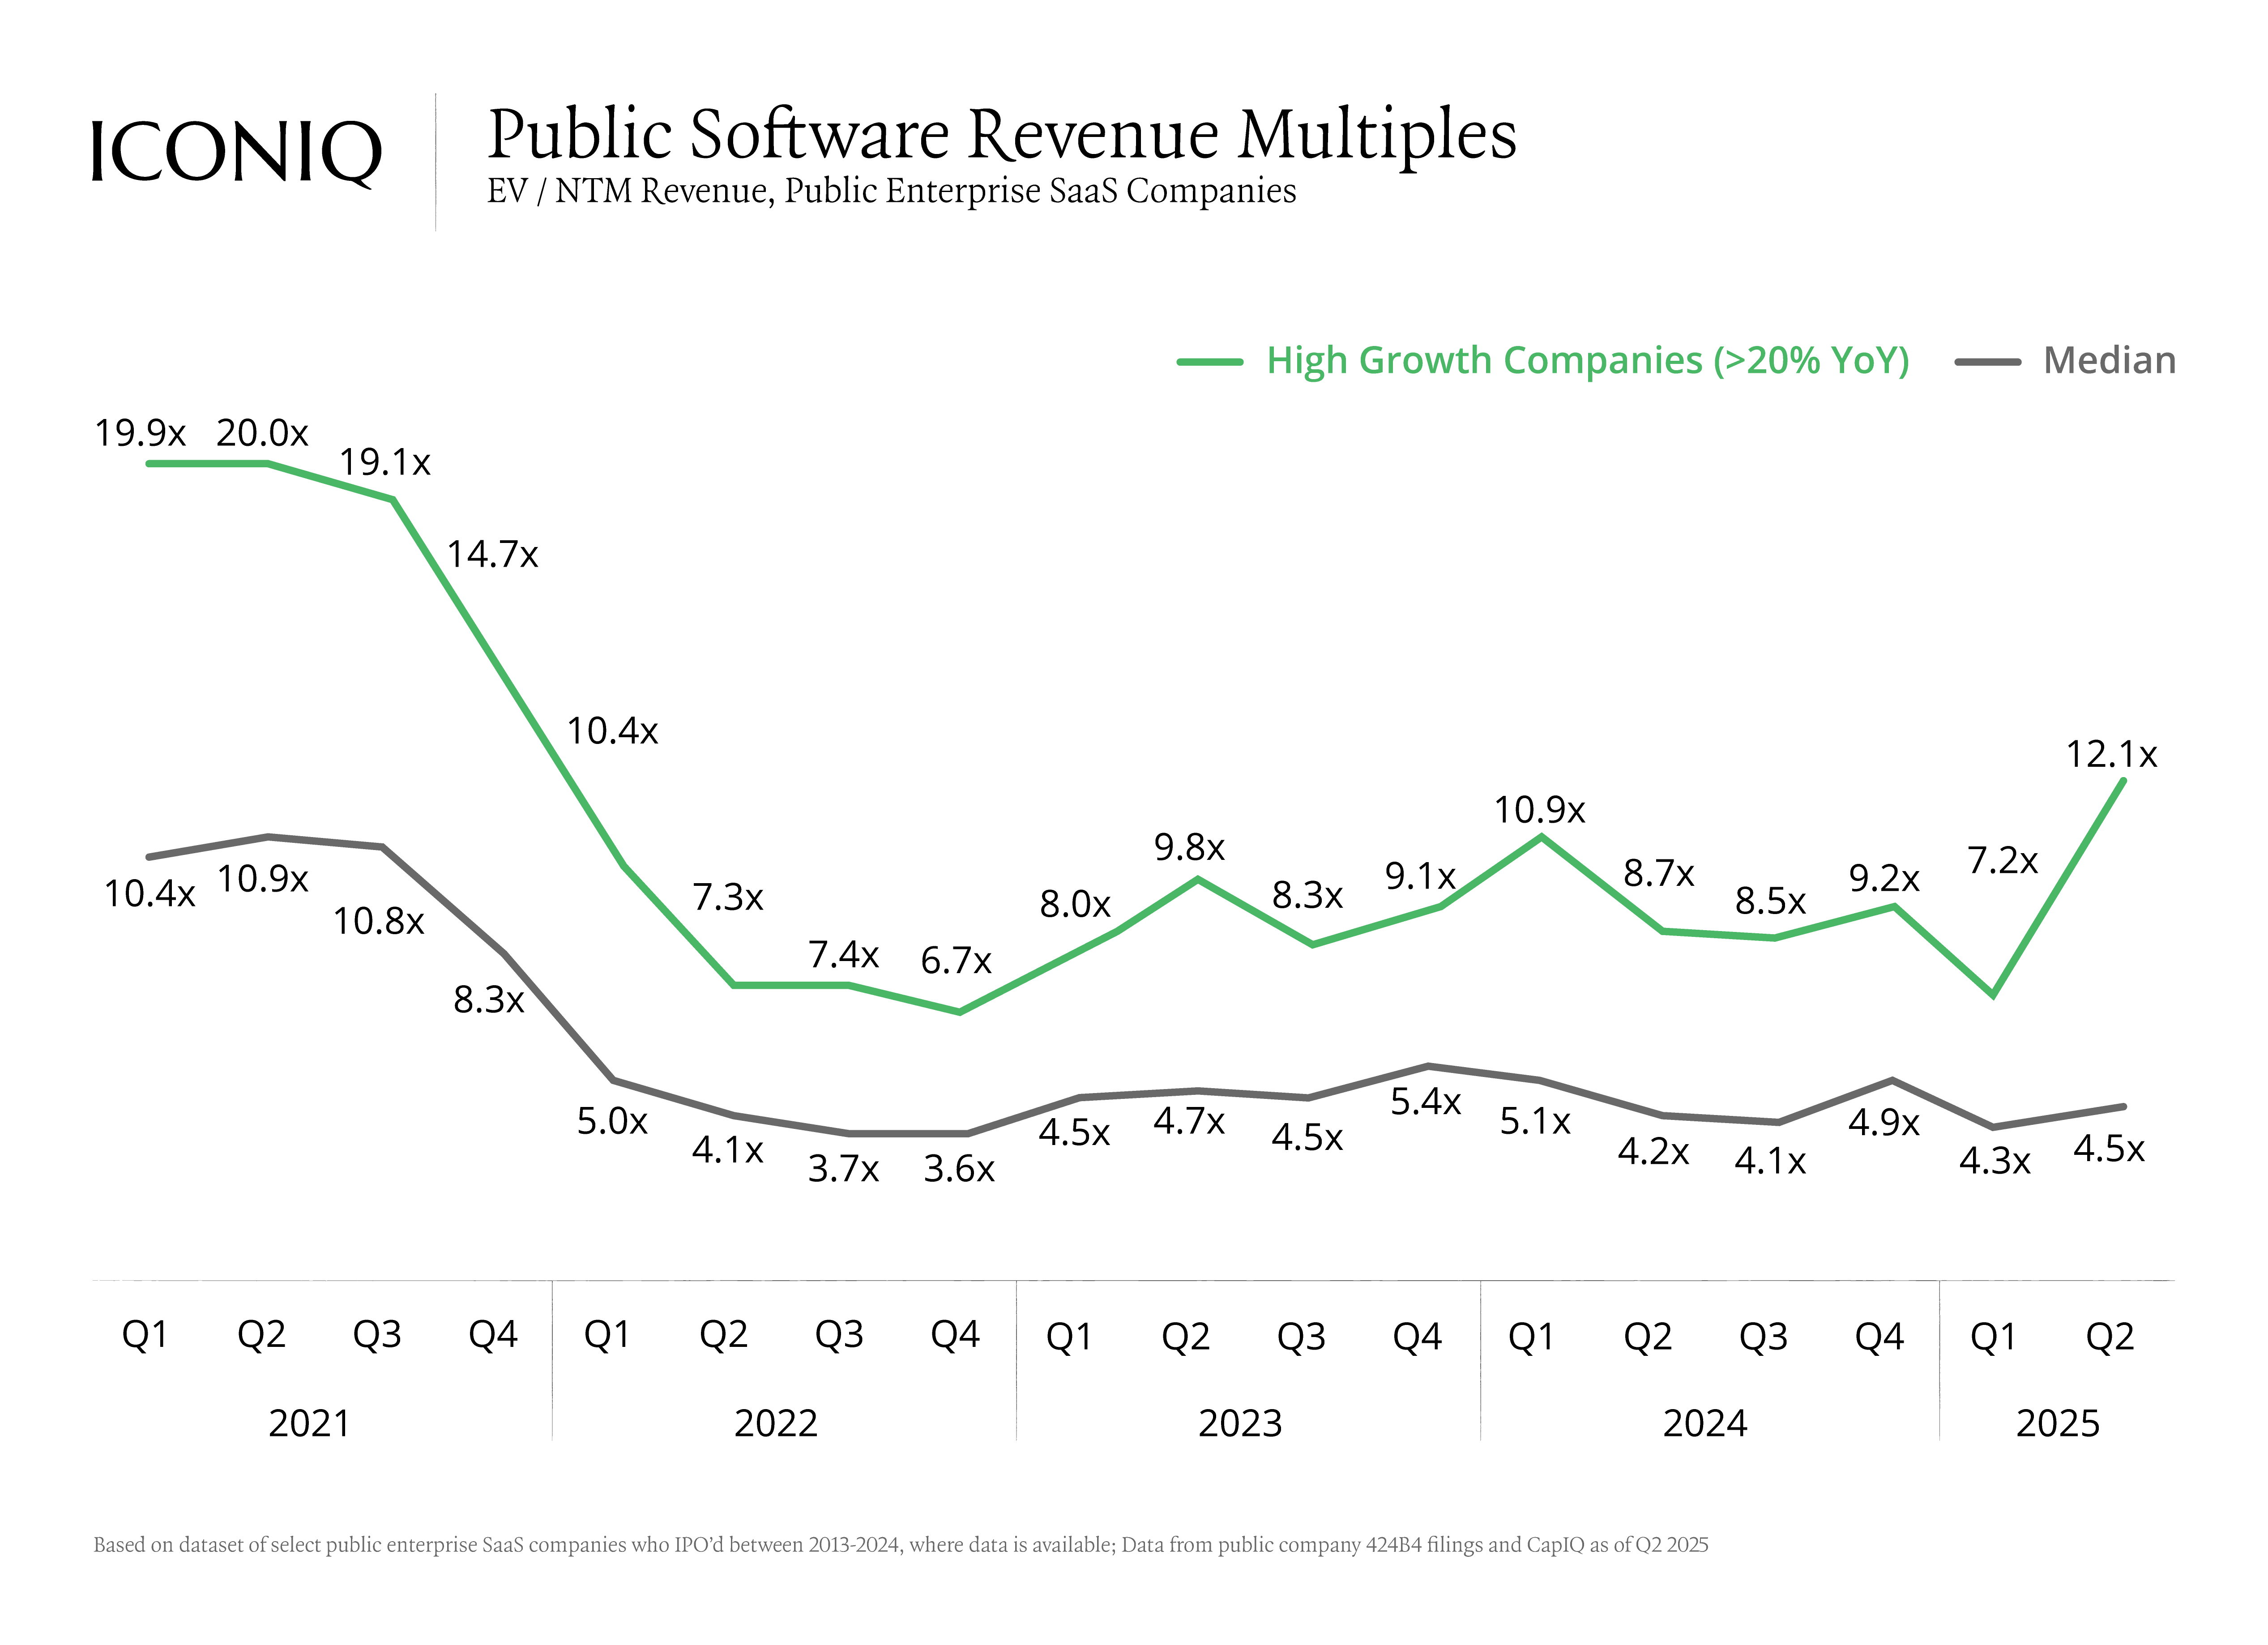
The state of the public market: efficient growth has become the primary signal, and AI is reshaping expectations
After two years of volatility and underperformance, public software markets are stabilizing. Stronger forecasting, sharper execution, and rising investor confidence, especially around AI, are contributing to a slow but steady recovery1.
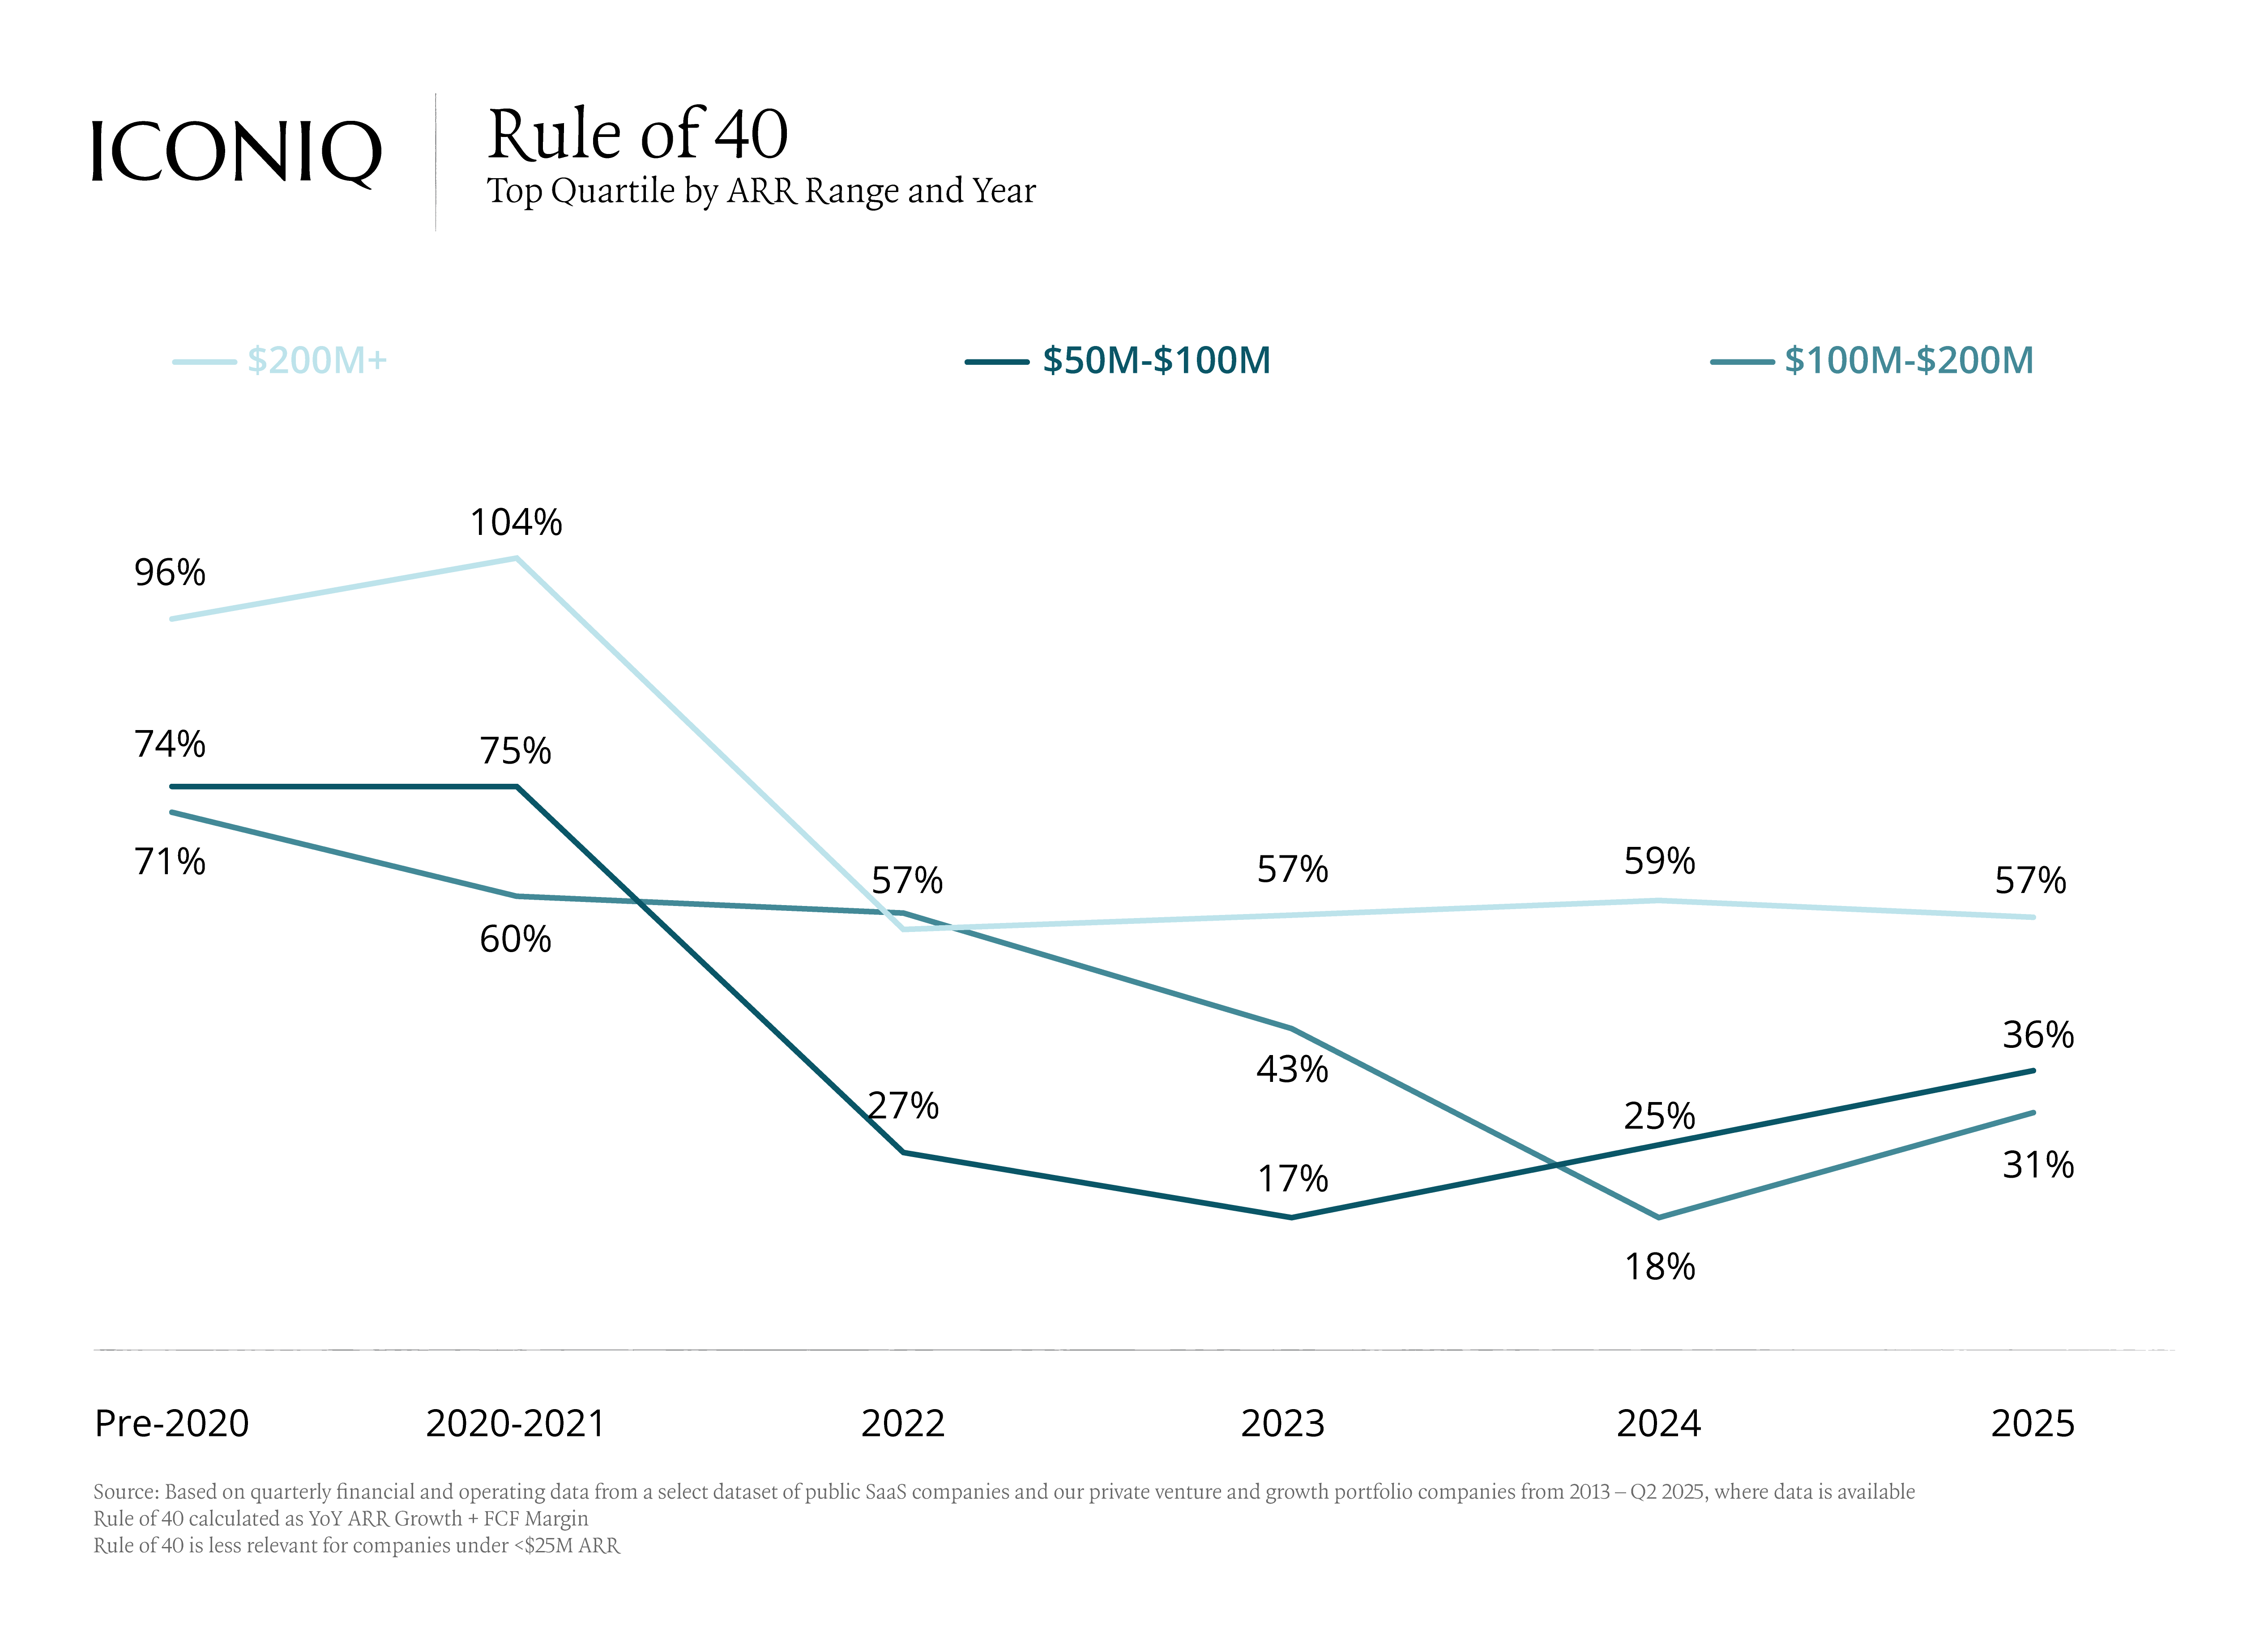
In this new environment, efficient growth has emerged as the dominant signal. Valuation multiples for public companies remain below historical peaks, but early signs point to renewed investor appetite for high-growth companies. Notably, the Rule of 40 has become the most reliable predictor of valuation, outperforming growth and net revenue retention in correlation with public market multiples over the past year. That said, growth still commands a premium. A 1-point increase in revenue growth has nearly twice the impact on valuation compared to an equivalent increase in free cash flow margin1.
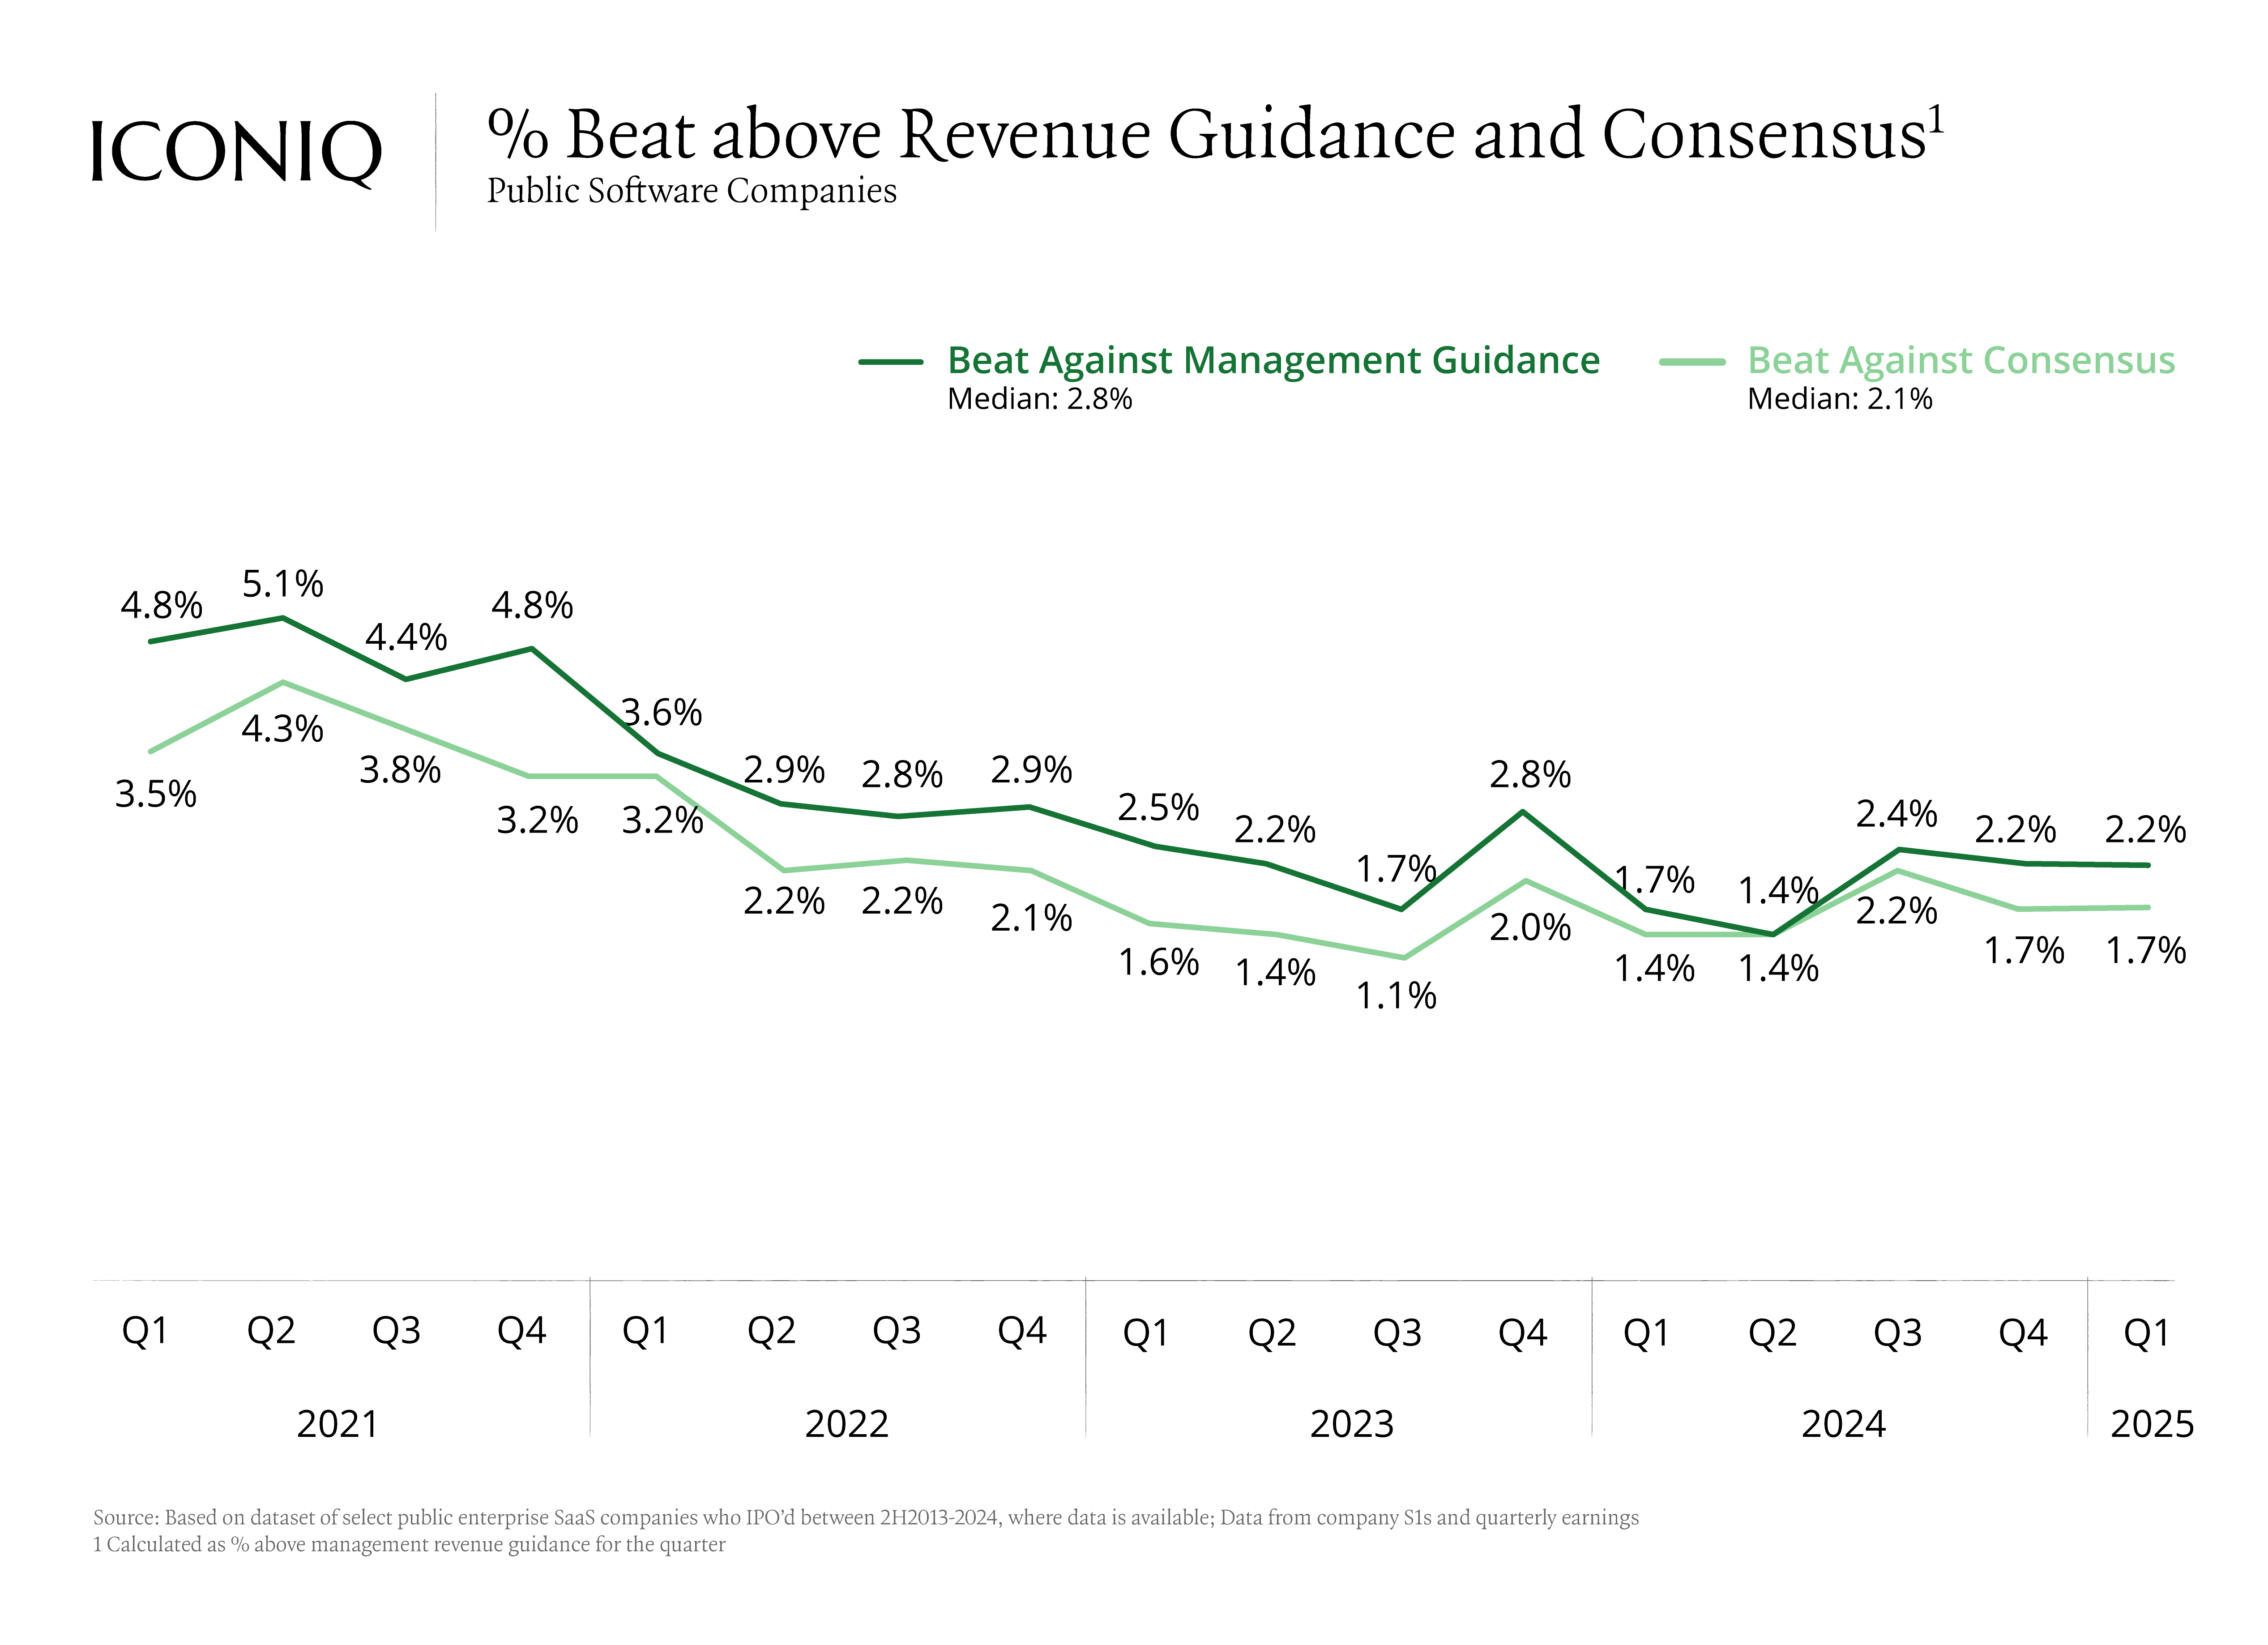
Meanwhile, AI – from both the builder and adopter perspectives – may be acting as a powerful counterweight to macro uncertainty. Beat rates appear to be rebounding, and both public and private markets are showing renewed conviction in software’s next frontier.


.png)
Compare your metrics with ICONIQ benchmarks, explore industry insights, and download custom reports for your Board meetings or fundraising efforts.
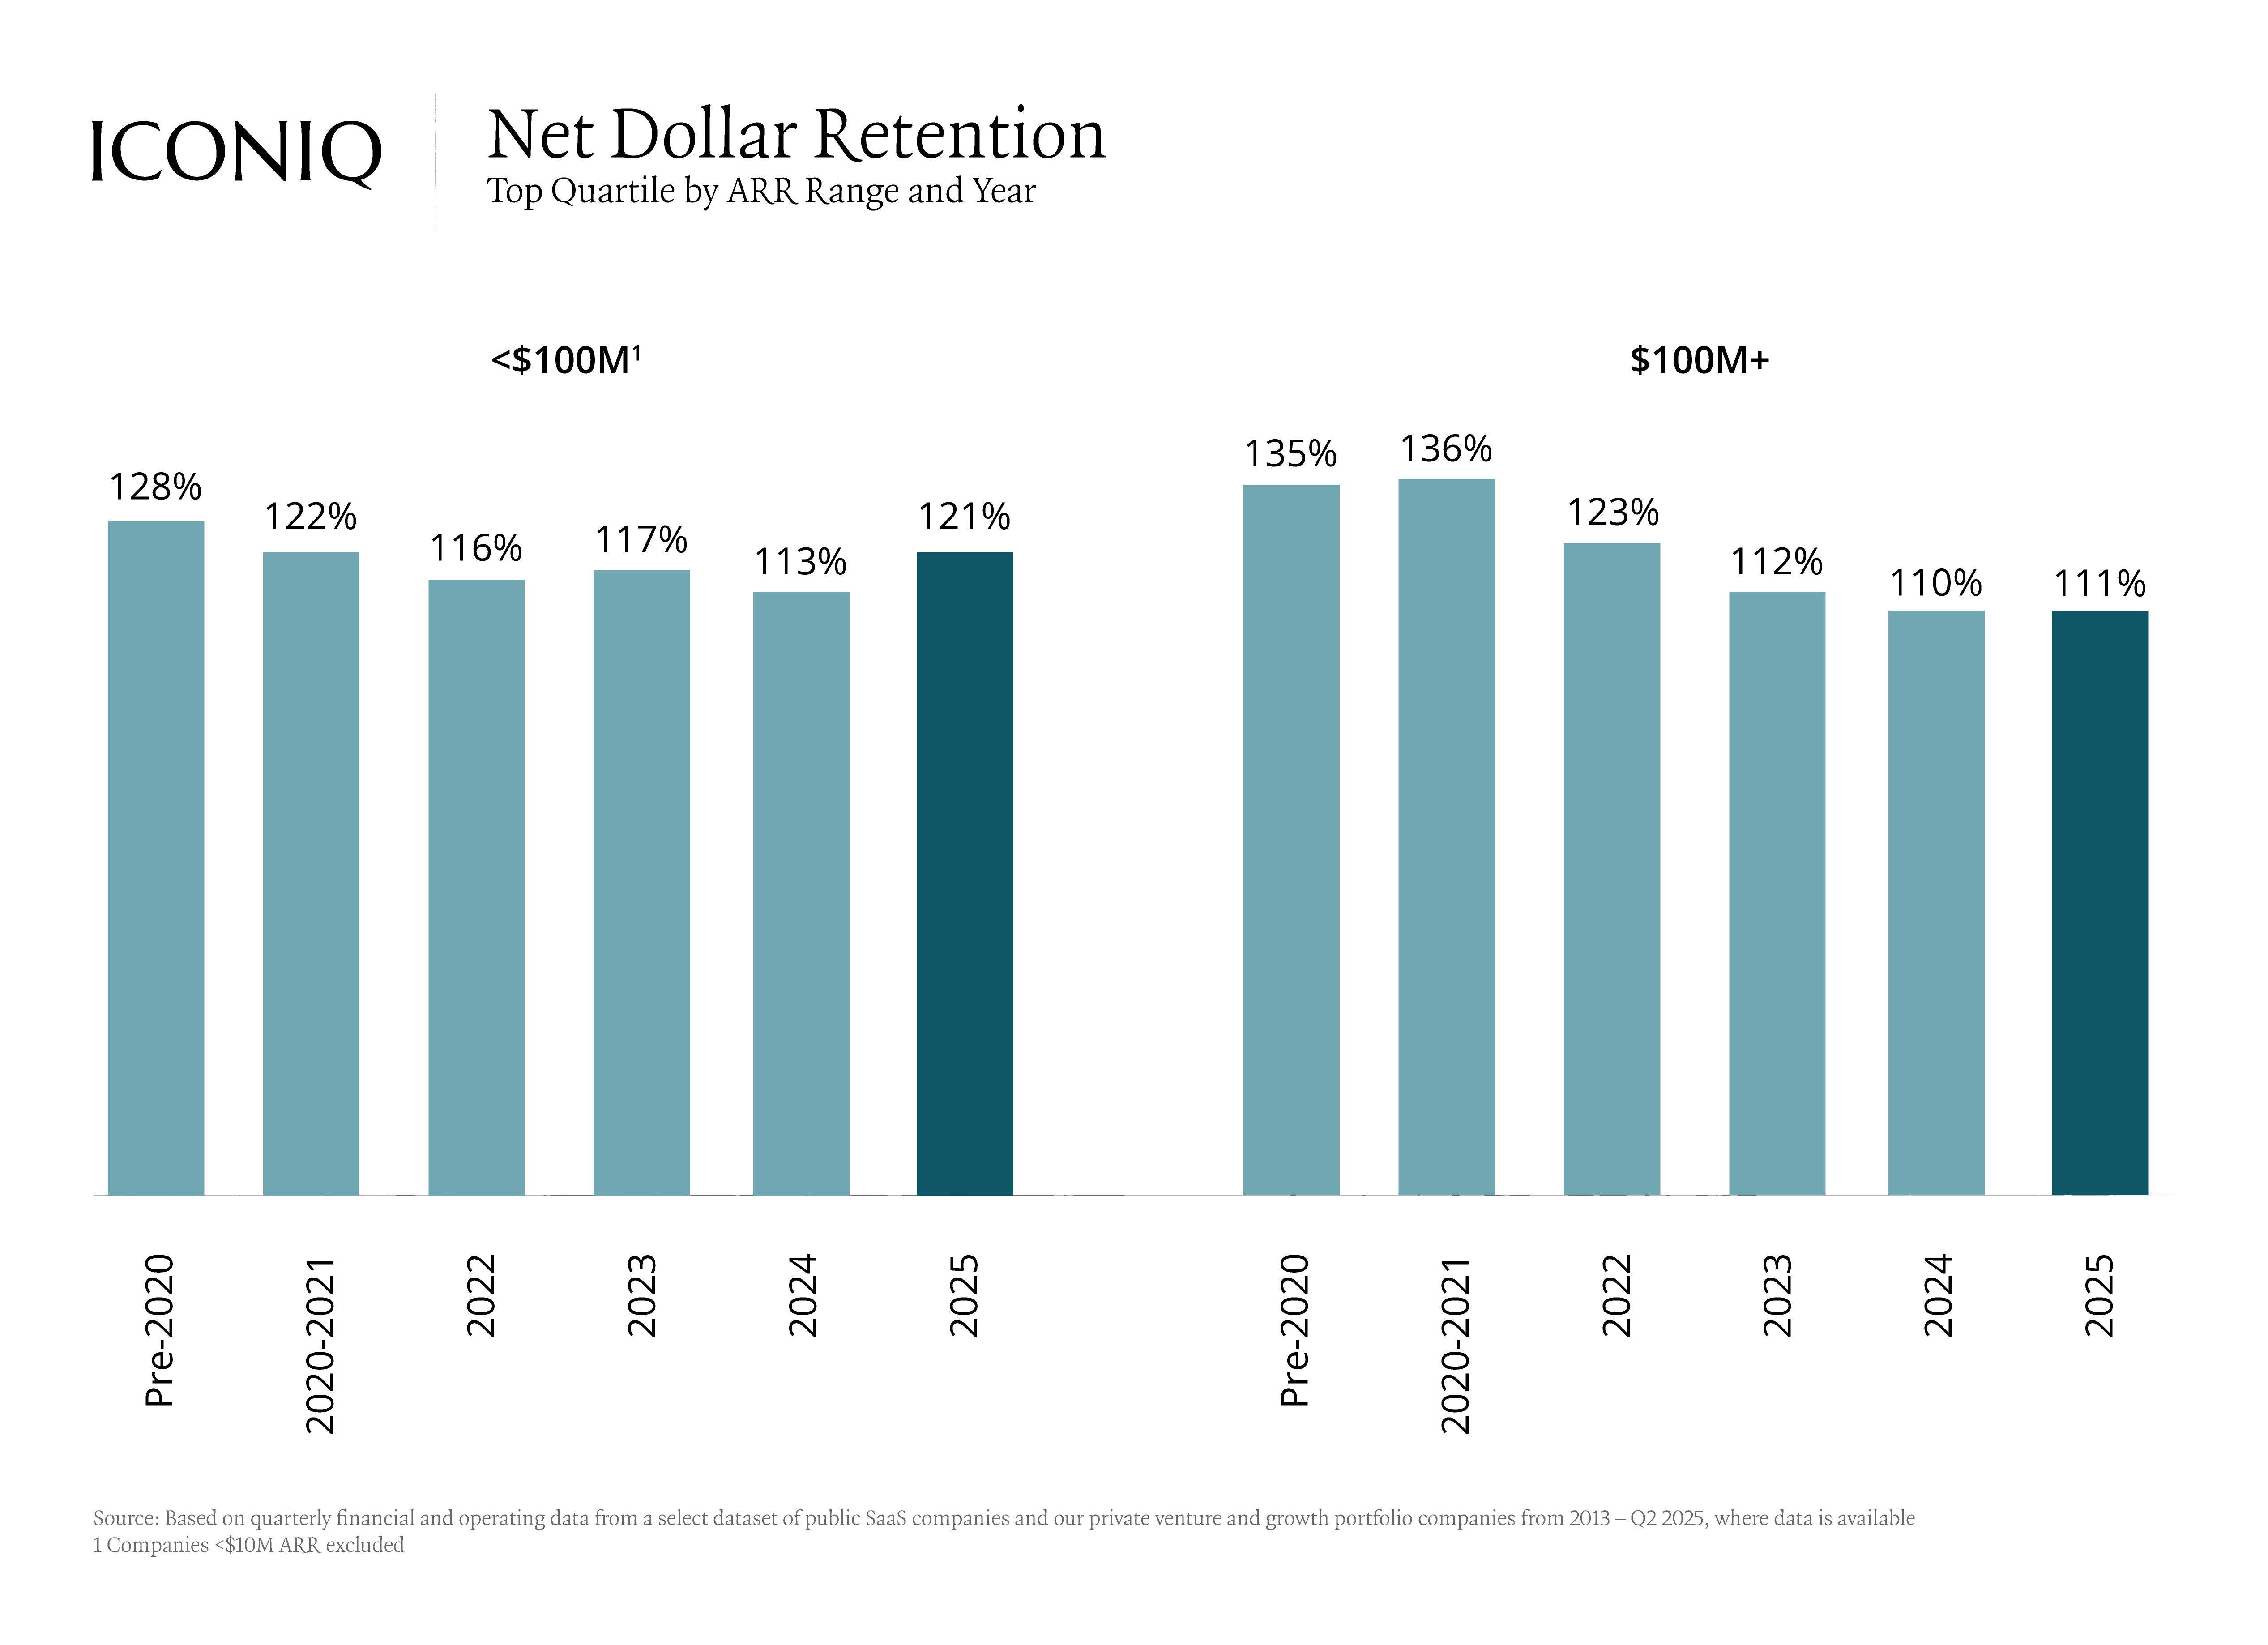
Software Fundamentals: Stabilizing Topline, Improving Efficiency
As market volatility abates, software fundamentals are showing signs of equilibrium. While topline growth remains uneven, we believe that companies are making major strides in efficiency-led execution. The result is stronger bottom-line performance and improving operating metrics1.
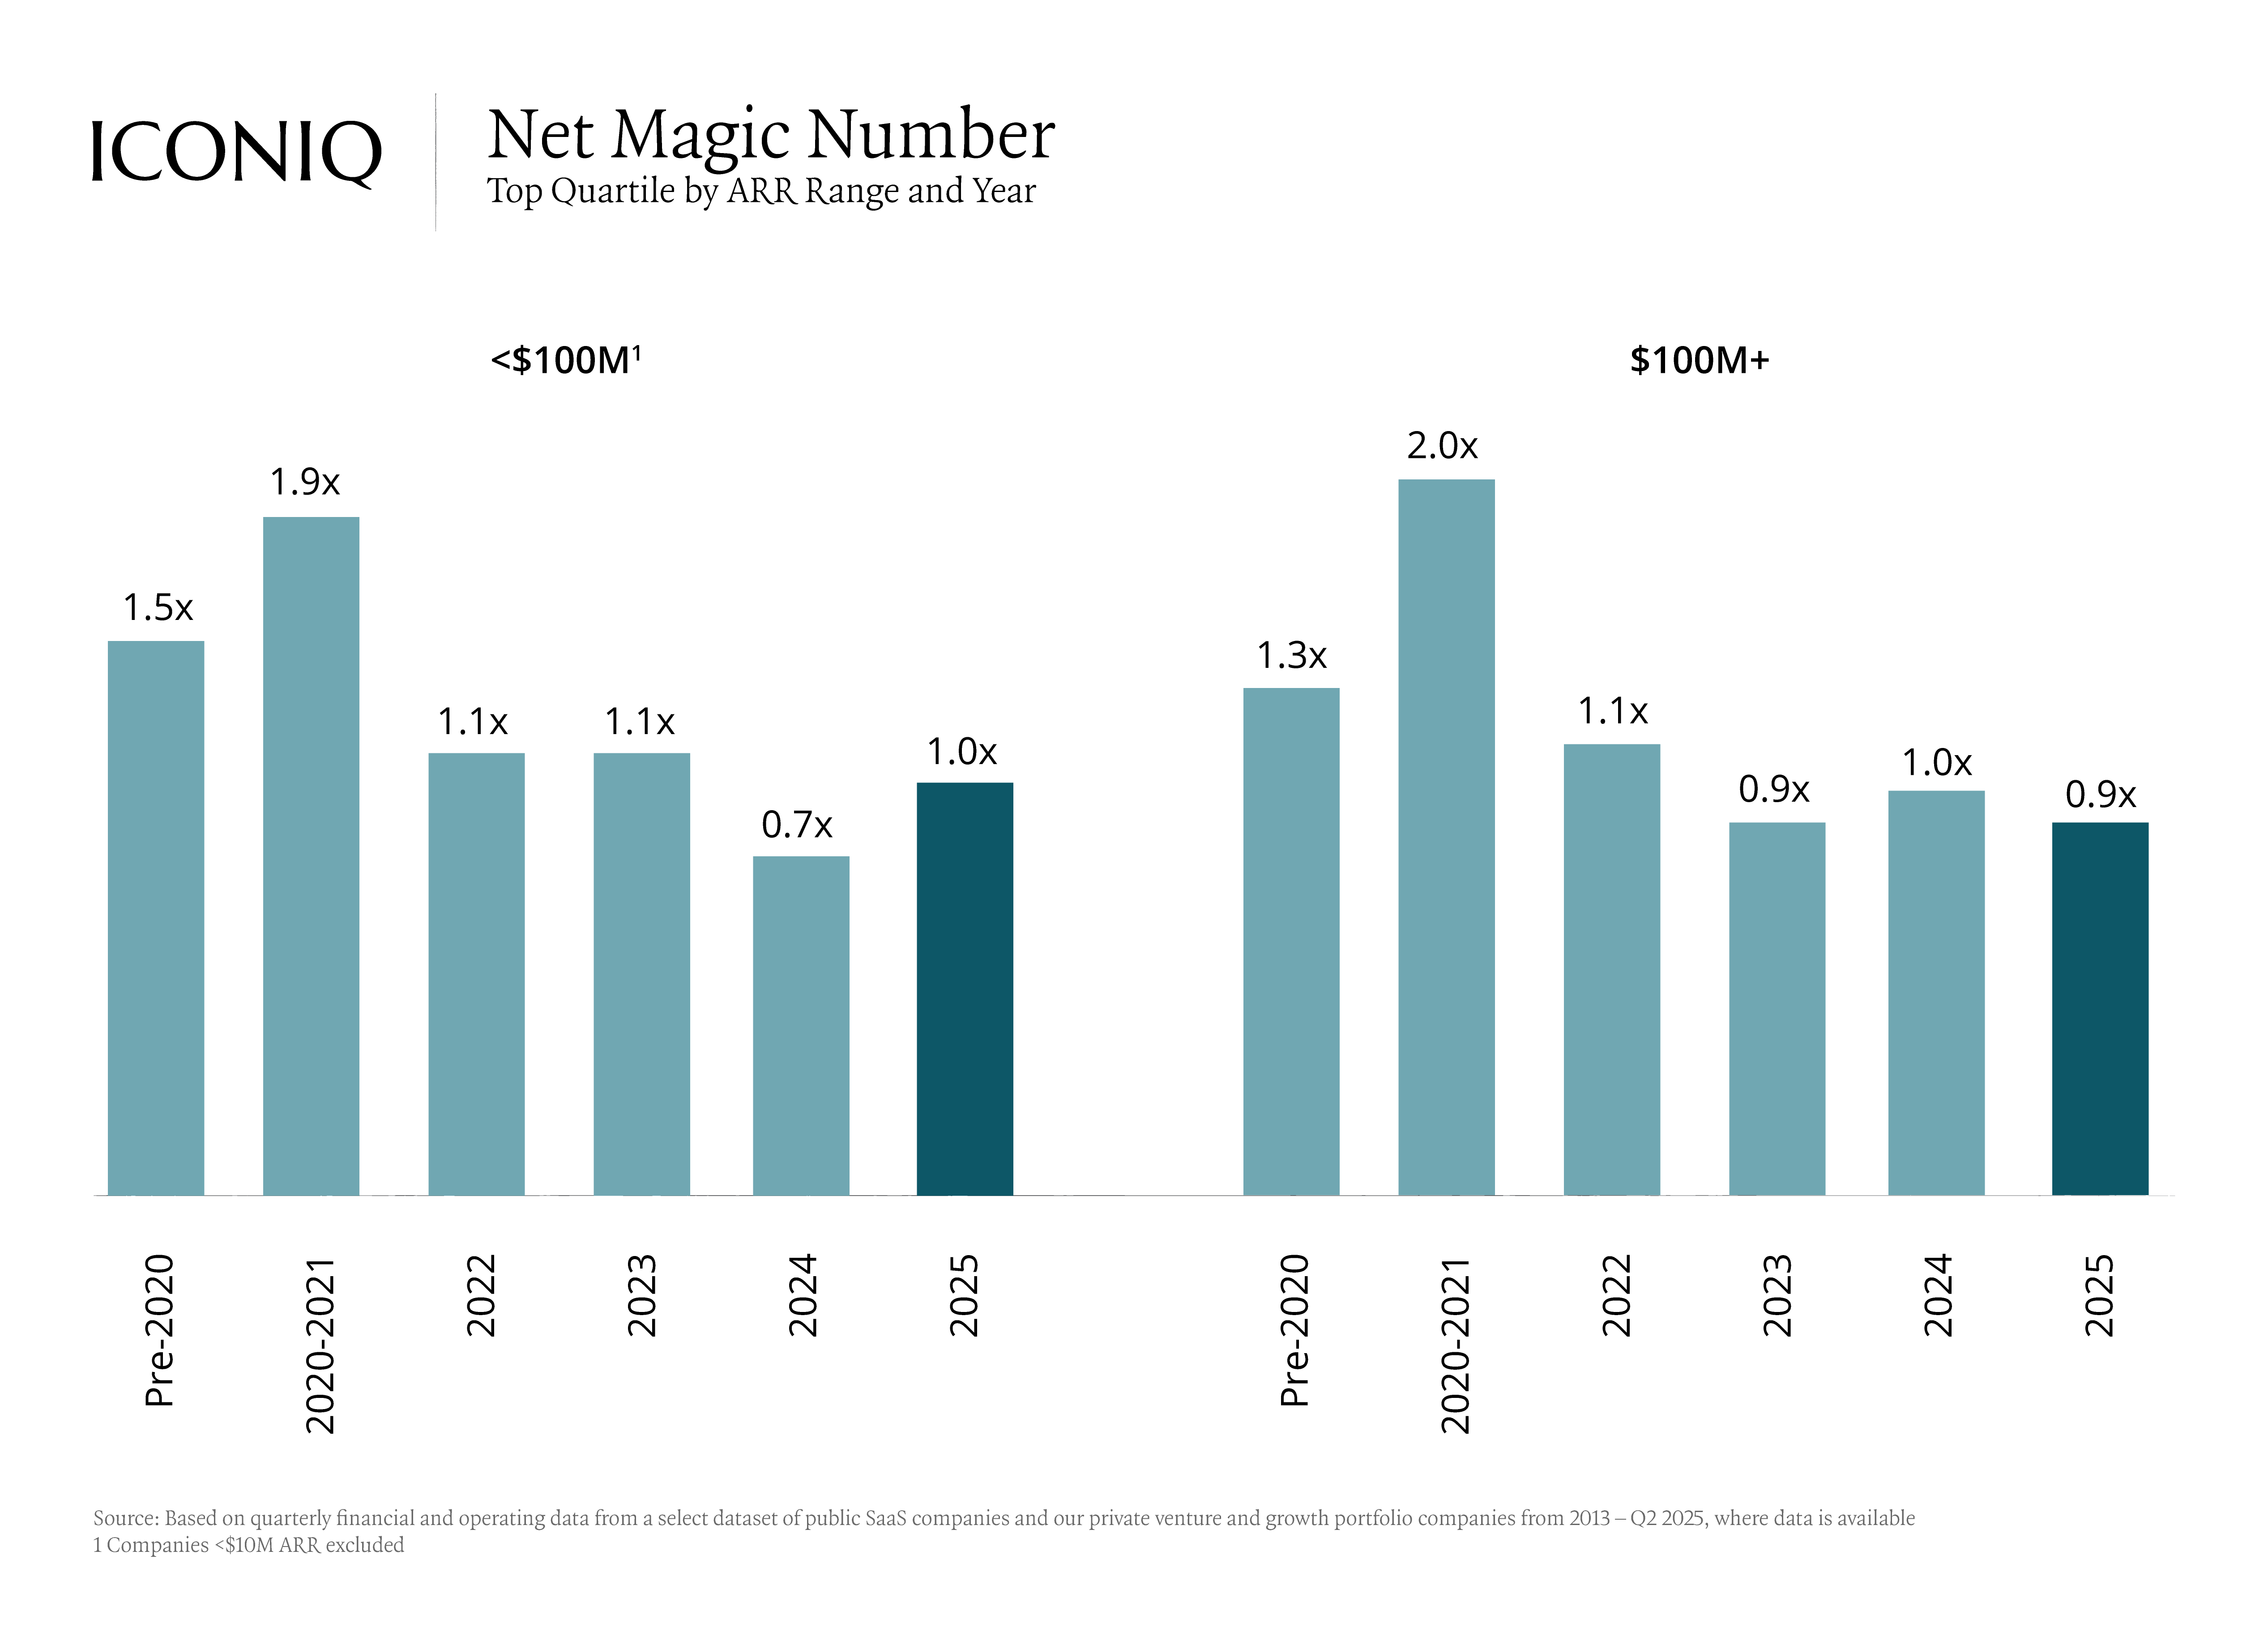
ARR has largely stabilized across the broader software market, with encouraging signs of reacceleration among mid-stage and AI companies. Meanwhile, net dollar retention is settling into a healthy ~110-120% range. Efficiency metrics are also showing tangible traction, with CAC payback period, net magic number, burn multiples, and Rule of 40 stabilizing1.
These improvements reflect more than just cost-cutting. We believe they signal a broader operational transformation. We think companies are rewiring how they operate, using AI and organizational redesign to unlock improvements in productivity and leverage.
.png)

Age of AI: A New Operating Model Is Emerging
AI no longer appears to be just a product feature – it could reshape the entire operating model of modern software companies. From product development to team structure to value creation, AI is influencing every layer of the business stack. It’s not just about smarter tools; it’s about a fundamentally different way of building and scaling software companies.
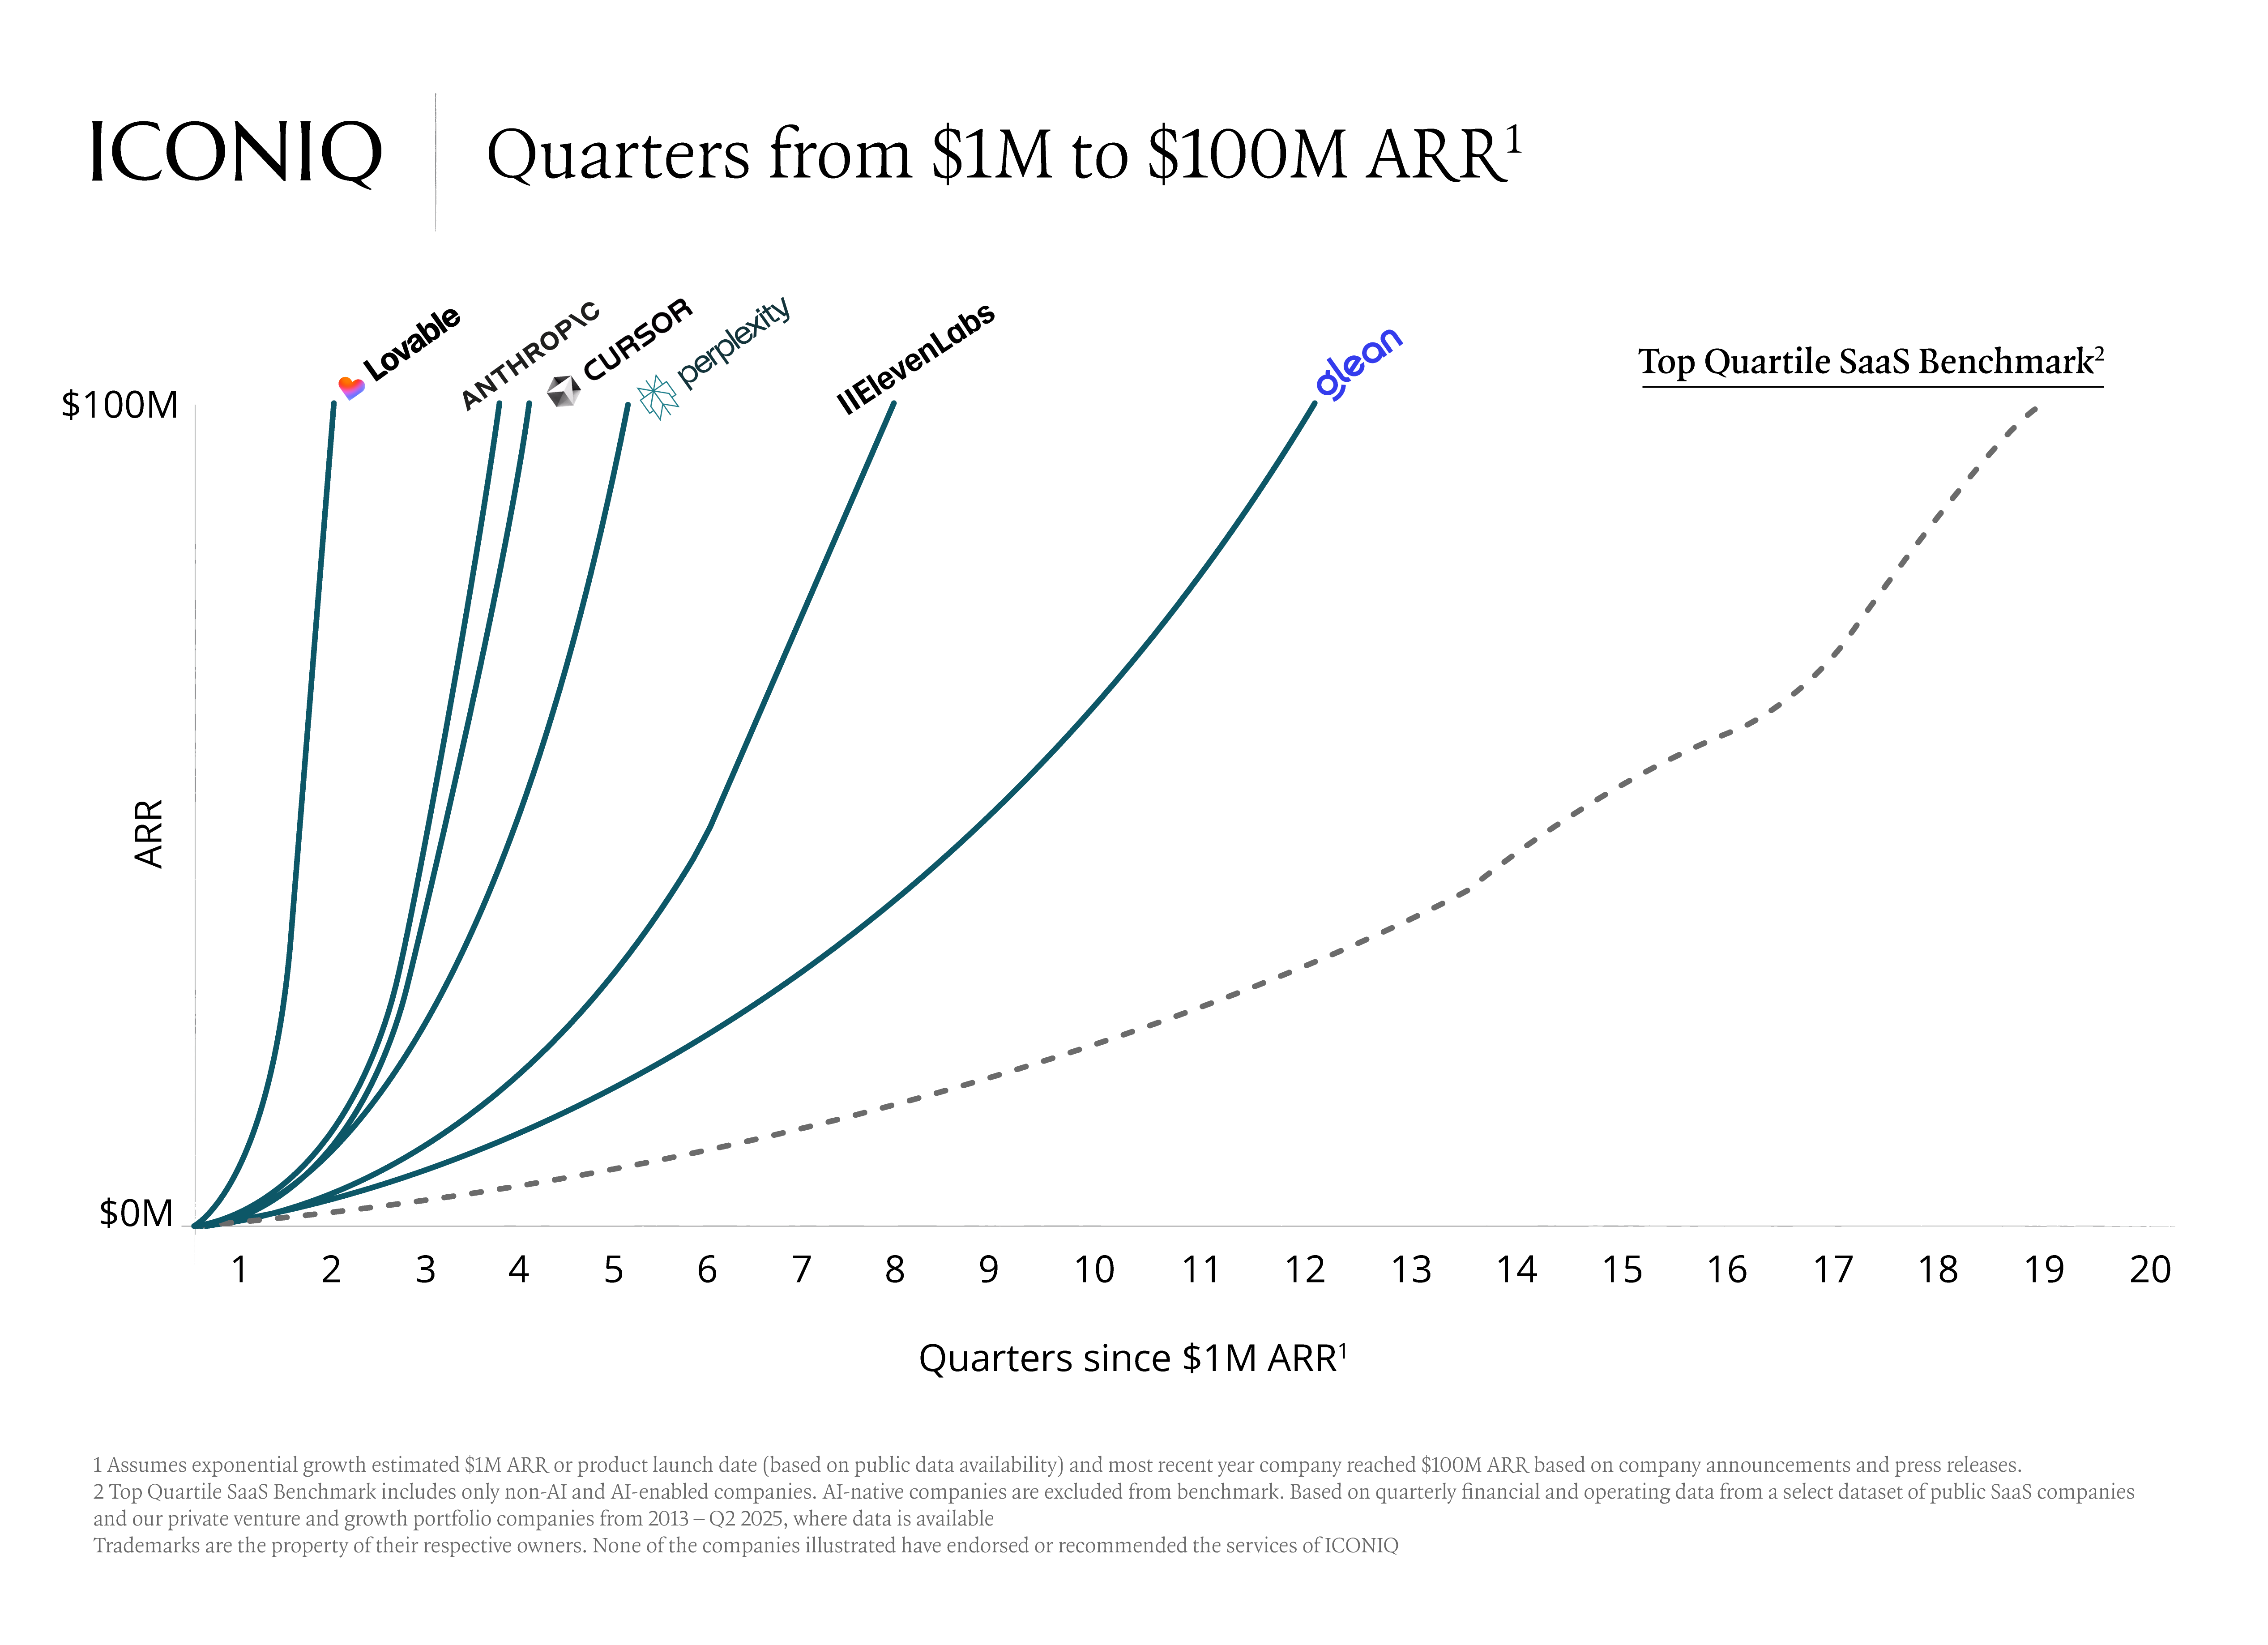
AI-native companies are setting a new bar for performance. The data shows these companies are scaling faster, more efficiently, and with fewer resources than their traditional SaaS counterparts. They’re growing 2-3x faster than top-quartile SaaS benchmarks, converting users to paying customers at significantly higher rates, and delivering stronger performance across critical efficiency metrics such as net magic number and burn multiple1.
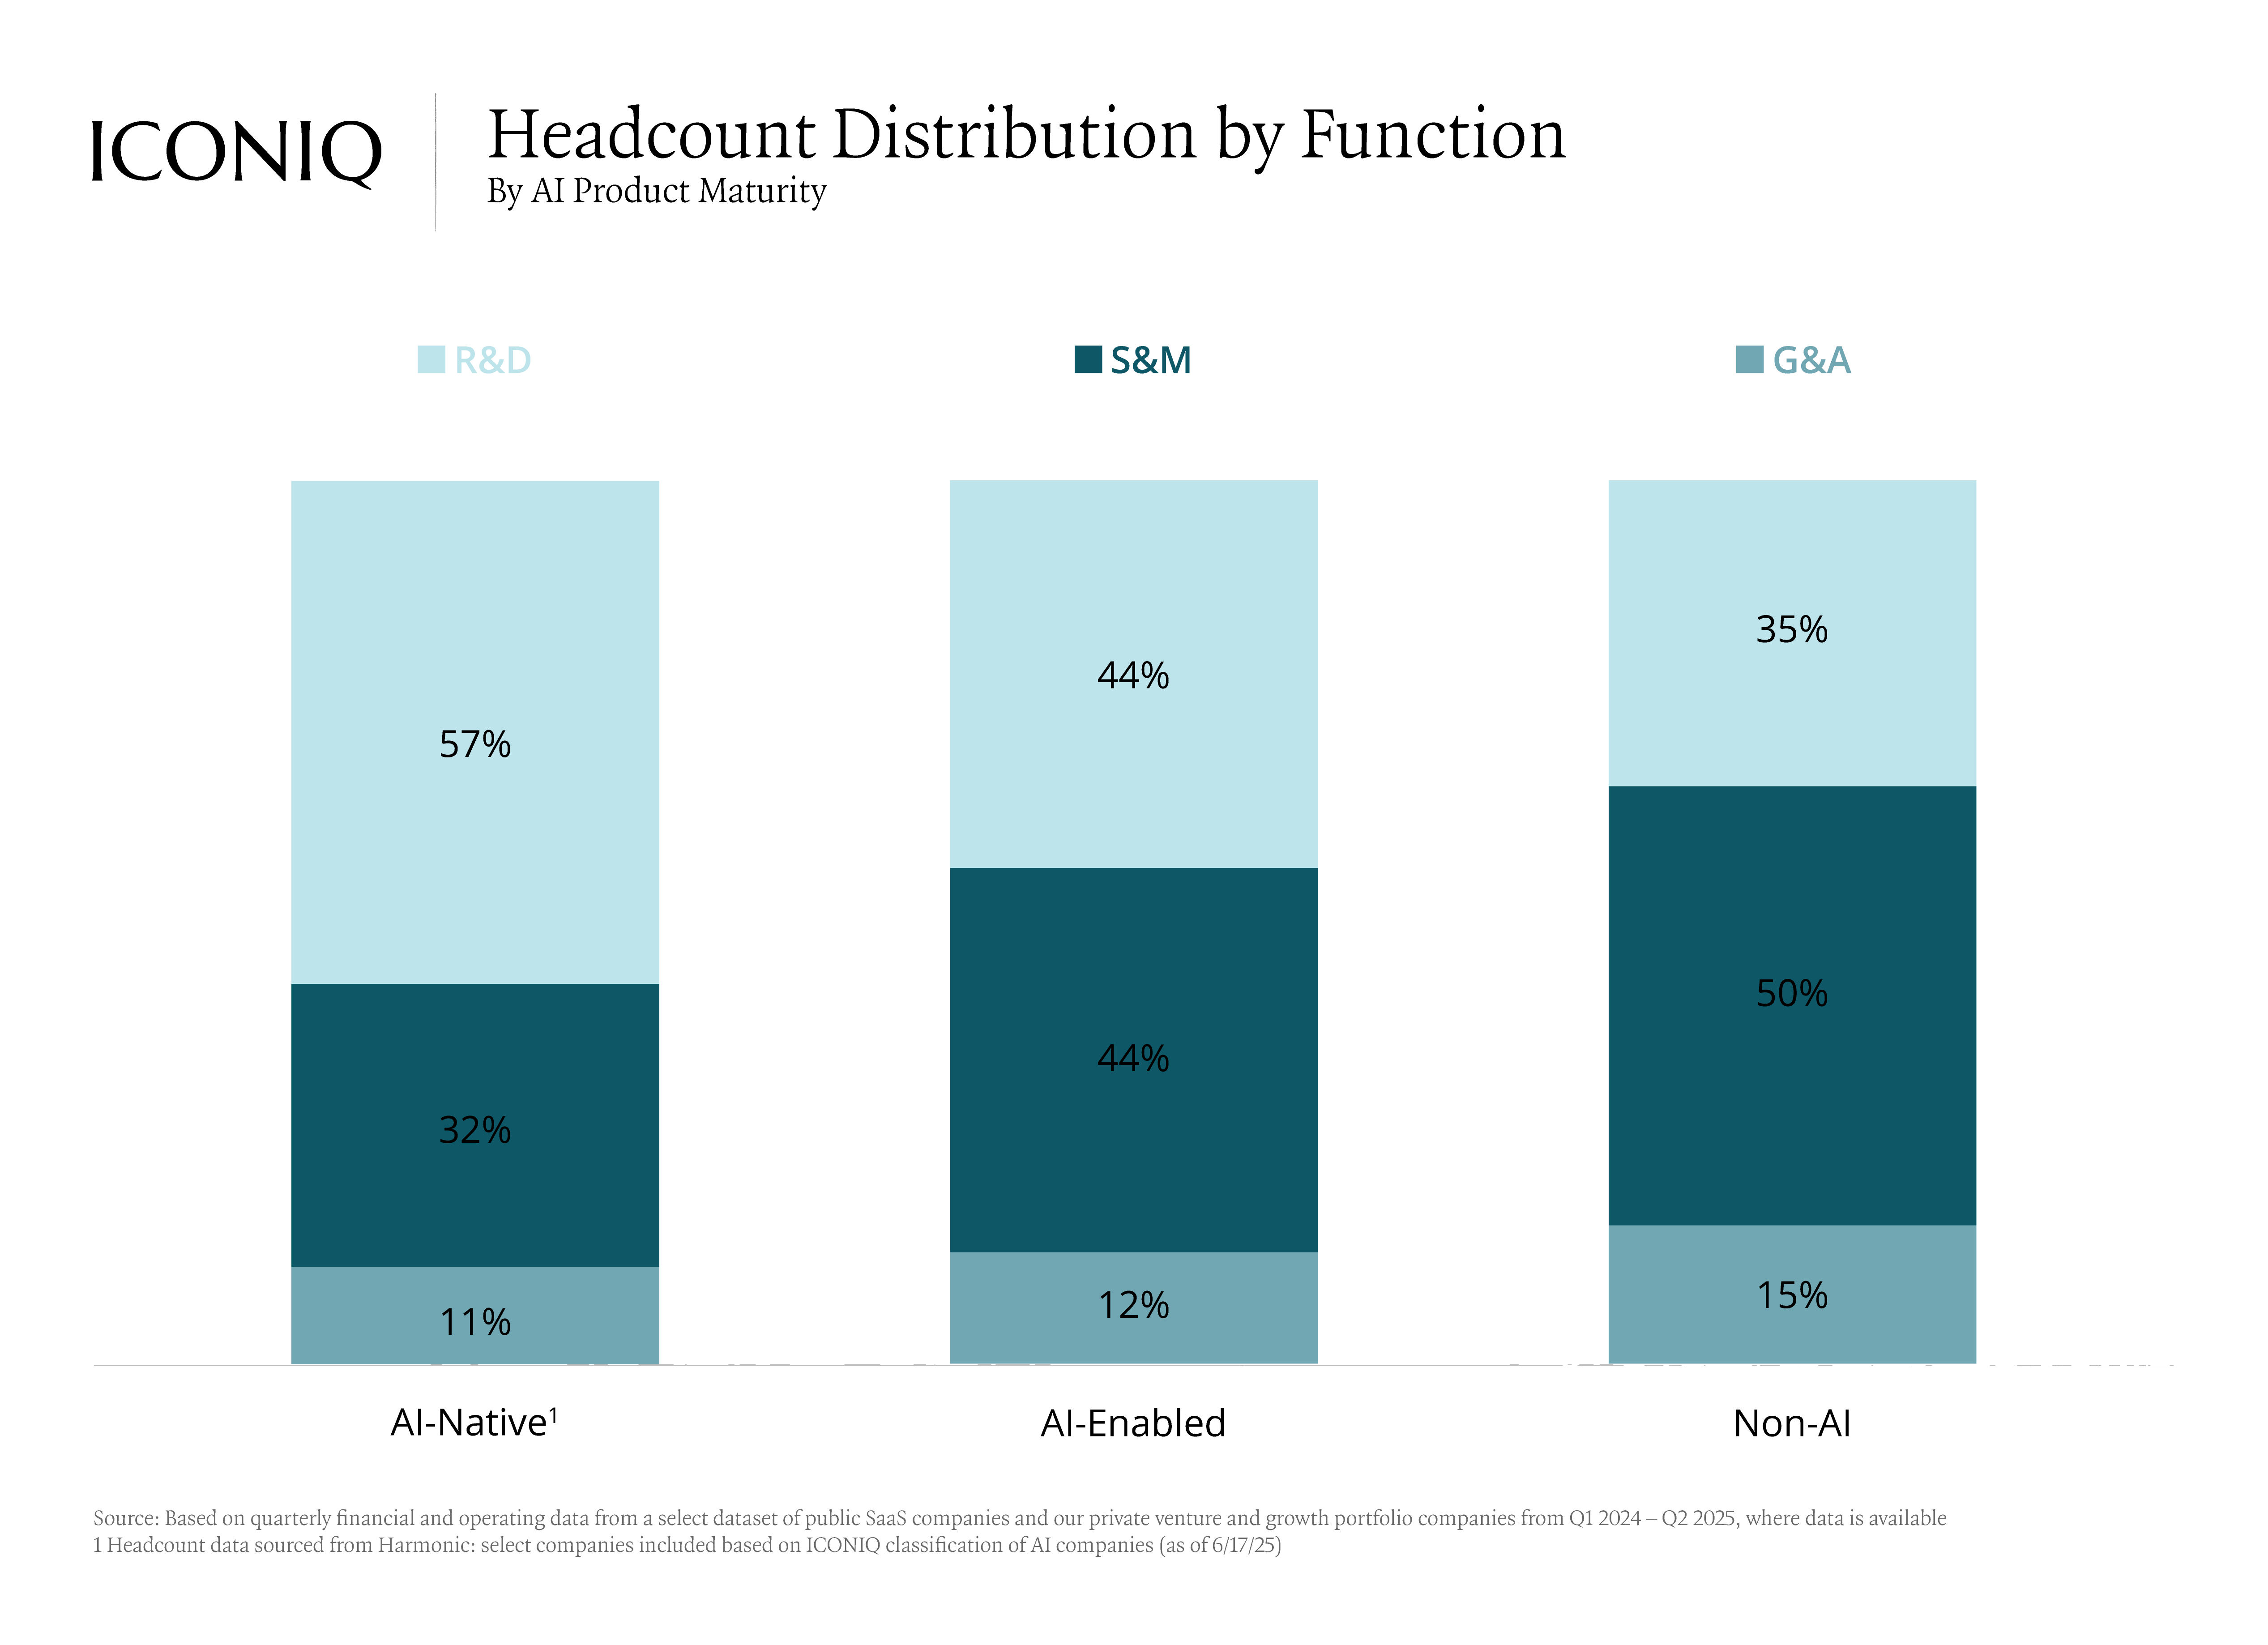
But we believe these results are not merely the byproduct of fast innovation cycles or favorable market timing. They may reflect a fundamentally new operating playbook – one built around workforce optimization and sharper go-to-market execution. For example, some AI-native companies are heavily investing in post-sales efforts to help shorten time-to-value and deepen product integration. Additionally, many AI-native companies are prioritizing R&D headcount, building high-leverage teams with deep technical fluency.
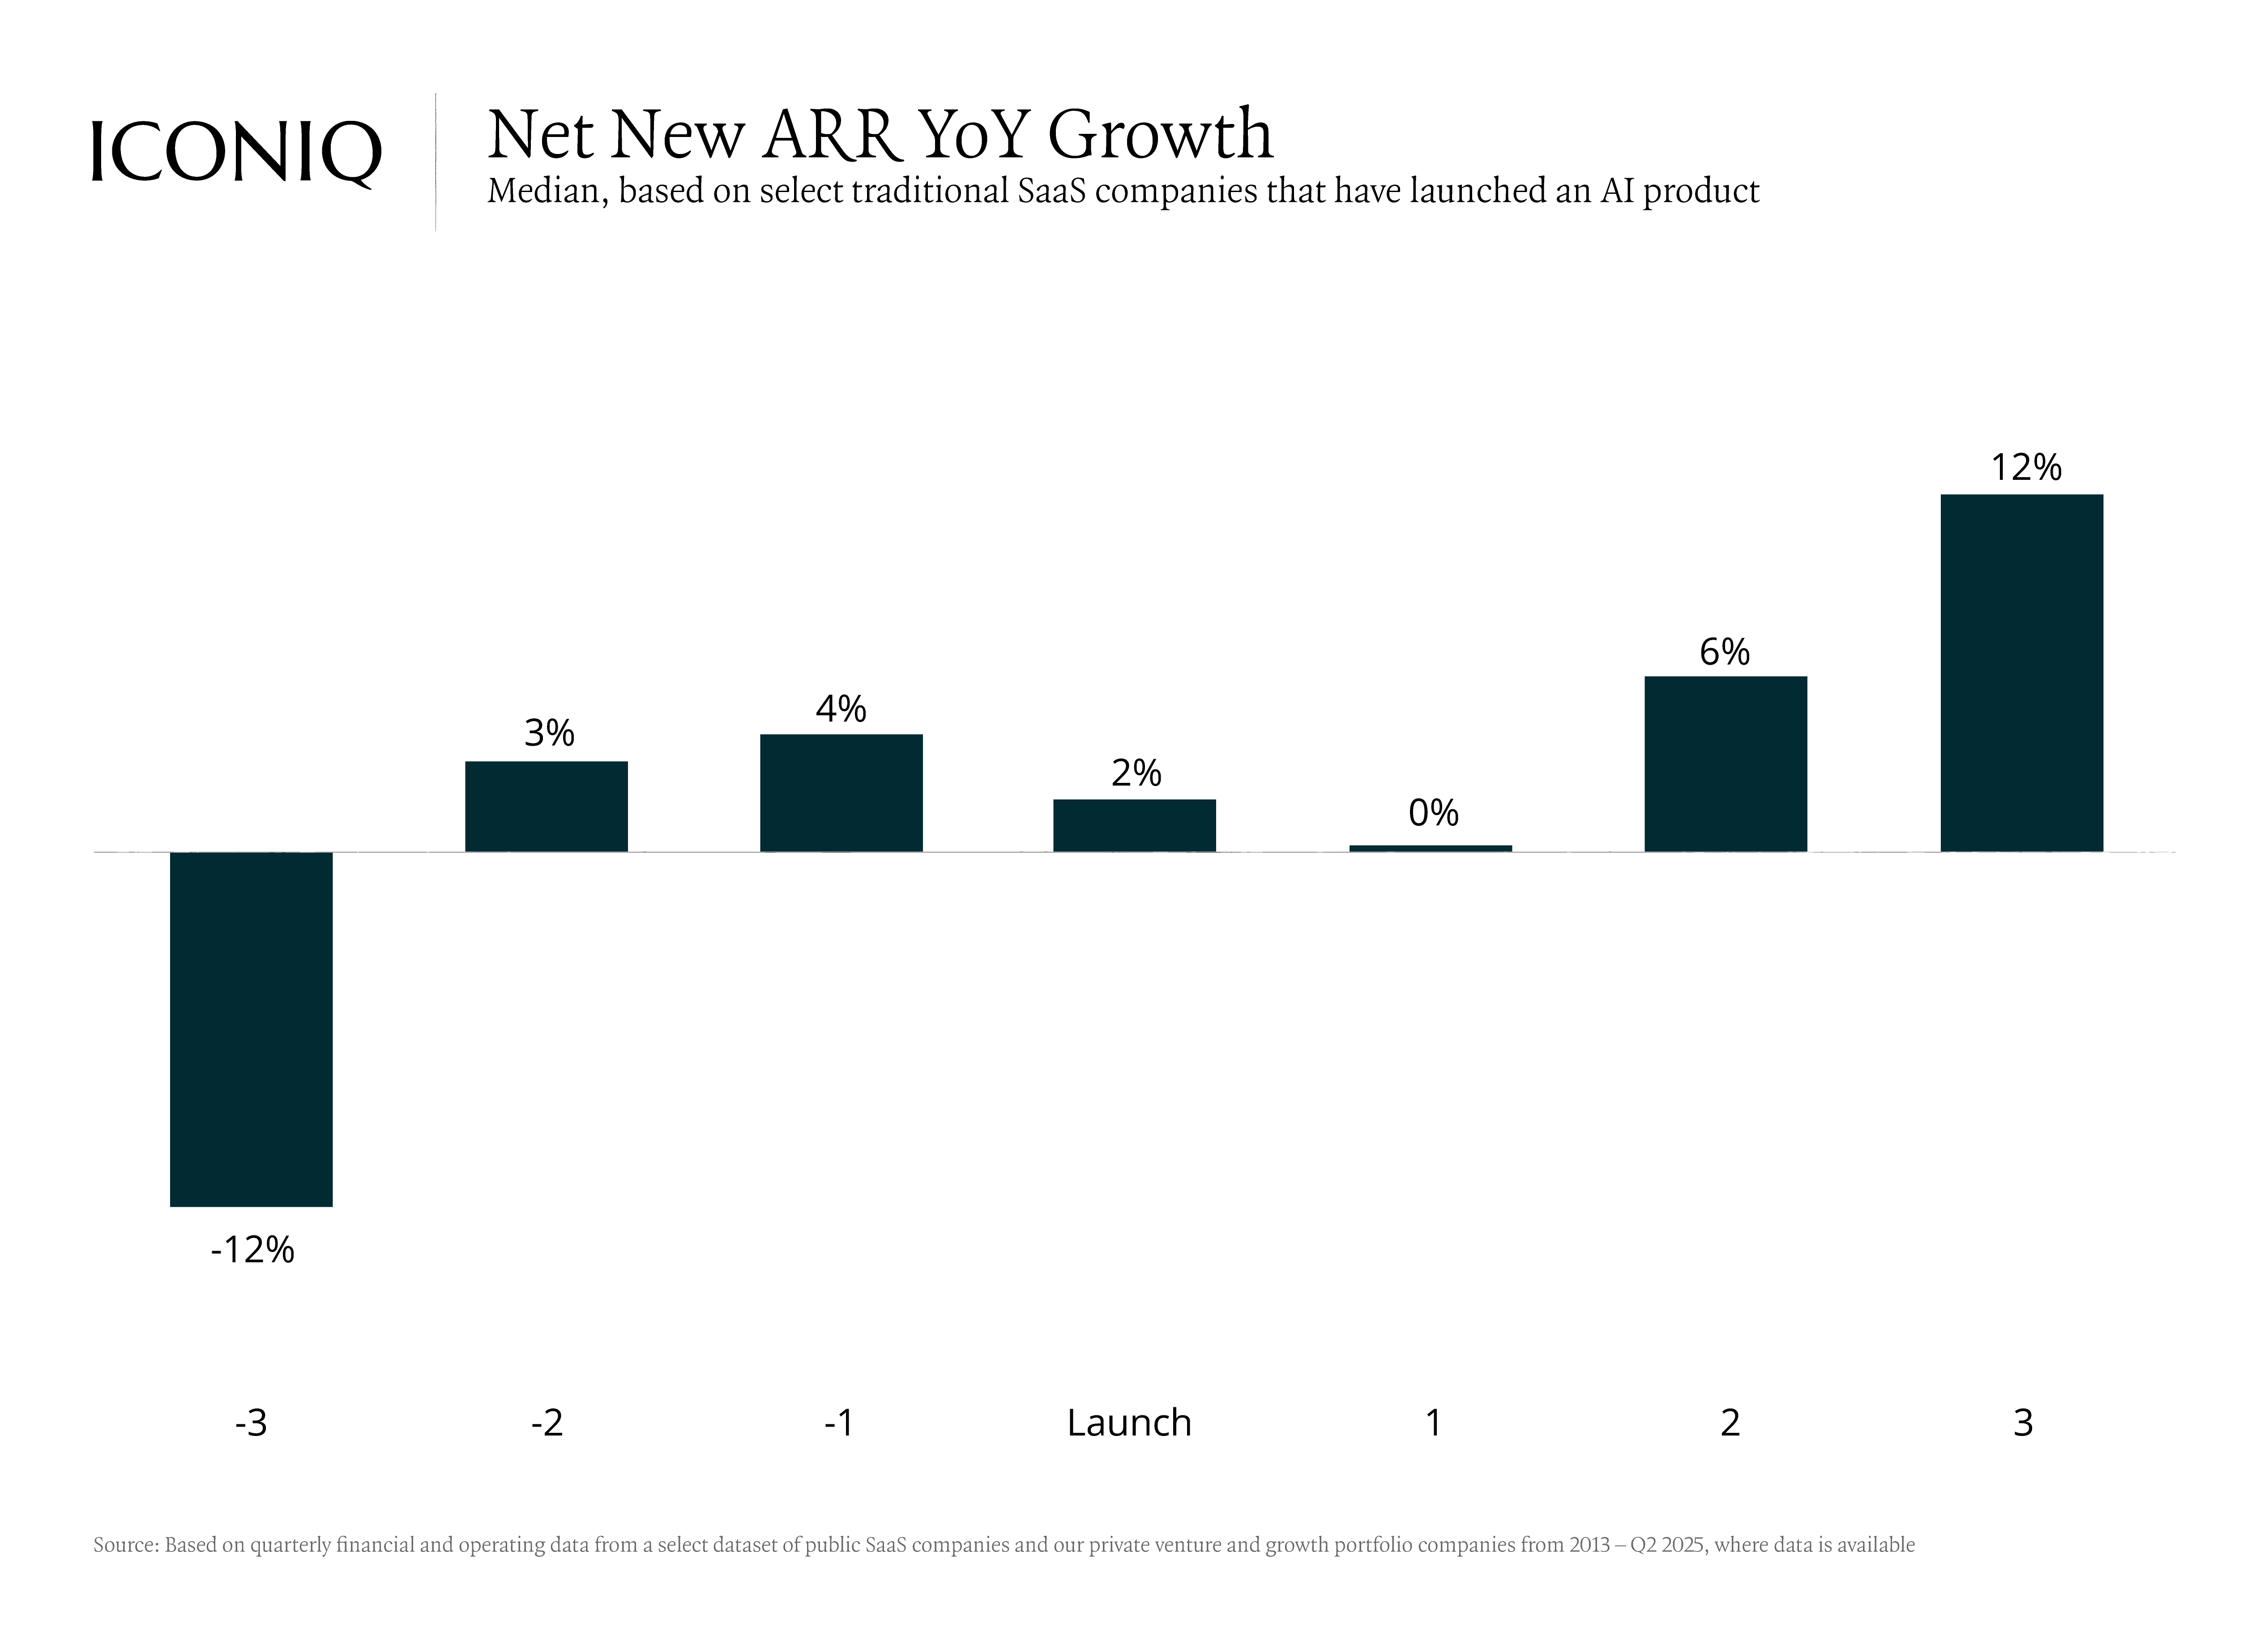
This model isn’t limited to startups. Incumbents that move quickly to embed AI into their products and workflows can reignite growth. We think AI is becoming a structural advantage, but only for those willing to integrate it deeply, deliberately, and with a clear line to customer value.
.png)
Final Thoughts
Even in an AI-transformed environment, the fundamentals of enduring software businesses still apply – growth, retention, efficiency, and scalability. But the bar has been raised. Today, our expectations around how quickly and effectively companies deliver on those fundamentals have shifted dramatically. This is no longer about simply hitting benchmarks. It’s about how intelligently and efficiently those milestones are achieved in an AI-powered world.
We continue to believe that the ICONIQ Enterprise Five remain enduring indicators of long-term success. We believe that winning teams are reimagining their playbooks, leaning into AI, and meeting this moment with urgency and precision.
The next generation of category leaders will be defined by how well they adapt to this new reality – not just by what they build, but by how they build it.
[1] Quarterly operating and financial data from the companies included in our 2025 State of Software analysis. Please reference the data sources, companies included, IPO performance criteria, and other methodology in the “State of Software 2025: Rethinking the Playbook” report. Unless otherwise indicated, references to “SaaS companies” or “software companies” only reflect trends observed with the companies included in the dataset.
Disclaimer
The views expressed in this presentation are those of ICONIQ Venture & Growth ("ICONIQ" or the "firm"), are the result of proprietary research, may be subjective, and may not be relied upon in making an investment decision.
This presentation is for general information purposes only and does not constitute investment advice. This presentation must not be relied upon in connection with any investment decision. The information in this presentation is not intended to and does not constitute financial, accounting, tax, legal, investment, consulting or other professional advice or services. Nothing in this presentation is or should be construed as an offer, invitation or solicitation to engage in any investment activity or transaction, including an offer to sell or a solicitation of an offer to buy any securities which should only be made pursuant to definitive offering documents and subscription agreements, including without limitation, any investment fund or investment product referenced herein.
Any reproduction or distribution of this presentation in whole or in part, or the disclosure of any of its contents, without the prior consent of ICONIQ, is strictly unauthorized.
This presentation may contain forward-looking statements based on current plans, estimates and projections. The recipient of this presentation ("you") are cautioned that a number of important factors could cause actual results or outcomes to differ materially from those expressed in, or implied by, the forward-looking statements. The numbers, figures and case studies included in this presentation have been included for purposes of illustration only, and no assurance can be given that the actual results of ICONIQ or any of its partners and affiliates will correspond with the results contemplated in the presentation. No information is contained herein with respect to conflicts of interest, which may be significant. The portfolio companies and other parties mentioned herein may reflect a selective list of the prior investments made by ICONIQ.
Certain of the economic and market information contained herein may have been obtained from published sources and/or prepared by other parties. While such sources are believed to be reliable, none of ICONIQ or any of its affiliates and partners, employees and representatives assume any responsibility for the accuracy of such information.
All of the information in the presentation is presented as of the date made available to you (except as otherwise specified), and is subject to change without notice, and may not be current or may have changed (possibly materially) between the date made available to you and the date actually received or reviewed by you. ICONIQ assumes no obligation to update or otherwise revise any information, projections, forecasts or estimates contained in the presentation, including any revisions to reflect changes in economic or market conditions or other circumstances arising after the date the items were made available to you or to reflect the occurrence of unanticipated events.
For avoidance of doubt, ICONIQ is not acting as an adviser or fiduciary in any respect in connection with providing this presentation and no relationship shall arise between you and ICONIQ as a result of this presentation being made available to you.
ICONIQ is a diversified financial services firm and has direct client relationships with persons that may become limited partners of ICONIQ funds. Notwithstanding that a person may be referred to herein as a "client" of the firm, no limited partner of any fund will, in its capacity as such, be a client of ICONIQ. There can be no assurance that the investments made by any ICONIQ fund will be profitable or will equal the performance of prior investments made by persons described in this presentation.
Any information in this presentation is directed at, and intended for, only persons who are experienced institutional or professional investors (“professional investors”) as defined by applicable law and regulation. Any person that is not a professional investor is not an intended recipient of this presentation and the matters discussed herein.
ICONIQ is a trading name of certain ICONIQ Partners (UK) LLP. ICONIQ Partners (UK) LLP (Registration Number: 973080) is an appointed representative of Kroll Securities Ltd. (Registration Number: 466588) which is authorised and regulated by the Financial Conduct Authority. ICONIQ Partners (UK) LLP is a limited liability partnership whose members are ICONIQ Capital (UK) Ltd, Seth Pierrepont and Lou Thorne, and it is registered in England and Wales and has its registered office at 27 Soho Square, London W1D 3QR. ICONIQ Partners (UK) LLP acts as an adviser to ICONIQ Capital LLC
Unless otherwise indicated, the views expressed in this presentation are those of ICONIQ Venture and Growth (“ICONIQ" or the “Firm"), are the result of proprietary research, may be subjective, and may not be relied upon in making an investment decision. Information used in this presentation was obtained from numerous sources. Certain of these companies are portfolio companies of ICONIQ Venture and Growth. ICONIQ Venture and Growth does not make any representations or warranties as to the accuracy of the information obtained from these sources.
This presentation is for general information purposes only and does not constitute investment advice. This presentation must not be relied upon in connection with any investment decision. The information in this presentation is not intended to and does not constitute financial, accounting, tax, legal, investment, consulting or other professional advice or services. Nothing in this presentation is or should be construed as an offer, invitation or solicitation to engage in any investment activity or transaction, including an offer to sell or a solicitation of an offer to buy any securities which should only be made pursuant to definitive offering documents and subscription agreements, including without limitation, any investment fund or investment product referenced herein.
Any reproduction or distribution of this presentation in whole or in part, or the disclosure of any of its contents, without the prior consent of ICONIQ, is strictly unauthorized.
This presentation may contain forward-looking statements based on current plans, estimates and projections. The recipient of this presentation ("you") are cautioned that a number of important factors could cause actual results or outcomes to differ materially from those expressed in, or implied by, the forward-looking statements. The numbers, figures and case studies included in this presentation have been included for purposes of illustration only, and no assurance can be given that the actual results of ICONIQ or any of its partners and affiliates will correspond with the results contemplated in the presentation. No information is contained herein with respect to conflicts of interest, which may be significant. The portfolio companies and other parties mentioned herein may reflect a selective list of the prior investments made by ICONIQ.
Certain of the economic and market information contained herein may have been obtained from published sources and/or prepared by other parties. While such sources are believed to be reliable, none of ICONIQ or any of its affiliates and partners, employees and representatives assume any responsibility for the accuracy of such information.
All of the information in the presentation is presented as of the date made available to you (except as otherwise specified), and is subject to change without notice, and may not be current or may have changed (possibly materially) between the date made available to you and the date actually received or reviewed by you. ICONIQ assumes no obligation to update or otherwise revise any information, projections, forecasts or estimates contained in the presentation, including any revisions to reflect changes in economic or market conditions or other circumstances arising after the date the items were made available to you or to reflect the occurrence of unanticipated events. Numbers or amounts herein may increase or decrease as a result of currency fluctuations.
For avoidance of doubt, ICONIQ is not acting as an adviser or fiduciary in any respect in connection with providing this presentation and no relationship shall arise between you and ICONIQ as a result of this presentation being made available to you.
ICONIQ is a diversified financial services firm and has direct client relationships with persons that may become limited partners of ICONIQ funds. Notwithstanding that a person may be referred to herein as a "client" of the firm, no limited partner of any fund will, in its capacity as such, be a client of ICONIQ. There can be no assurance that the investments made by any ICONIQ fund will be profitable or will equal the performance of prior investments made by persons described in this presentation.
Any information in this presentation is directed at, and intended for, only persons who are experienced institutional or professional investors (“professional investors”) as defined by applicable law and regulation. Any person that is not a professional investor is not an intended recipient of this presentation and the matters discussed herein.
ICONIQ is a trading name of ICONIQ Partners (UK) LLP. ICONIQ Partners (UK) LLP (Registration Number: 973080) is an appointed representative of Kroll Securities Ltd. (Registration Number: 466588) which is authorised and regulated by the Financial Conduct Authority. ICONIQ Partners (UK) LLP is a limited liability partnership whose members are ICONIQ Capital (UK) Ltd, Seth Pierrepont and Lou Thorne, and it is registered in England and Wales and has its registered office at 27 Soho Square, London W1D 3QR. ICONIQ Partners (UK) LLP acts as an adviser to ICONIQ Capital LLC